
NexGraph
NexGraph software is free to download and connects to your Nextech force gauge or torque tester, allowing you to download, analyze saved data, and plot real-time graphs. Available on Windows and Android (beta).


Data Retrieval and Charting
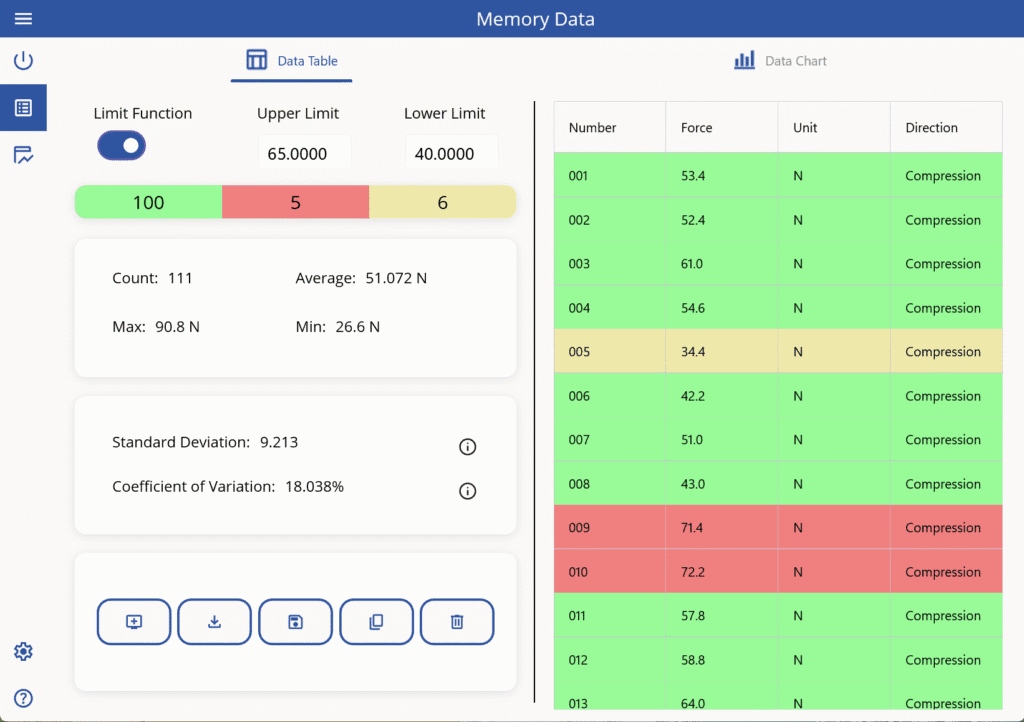
- Download stored test data
- Get the displayed peak value
- Send data from the “Print” button
- Pass and fail value highlighting
- Export data CSV to Documents
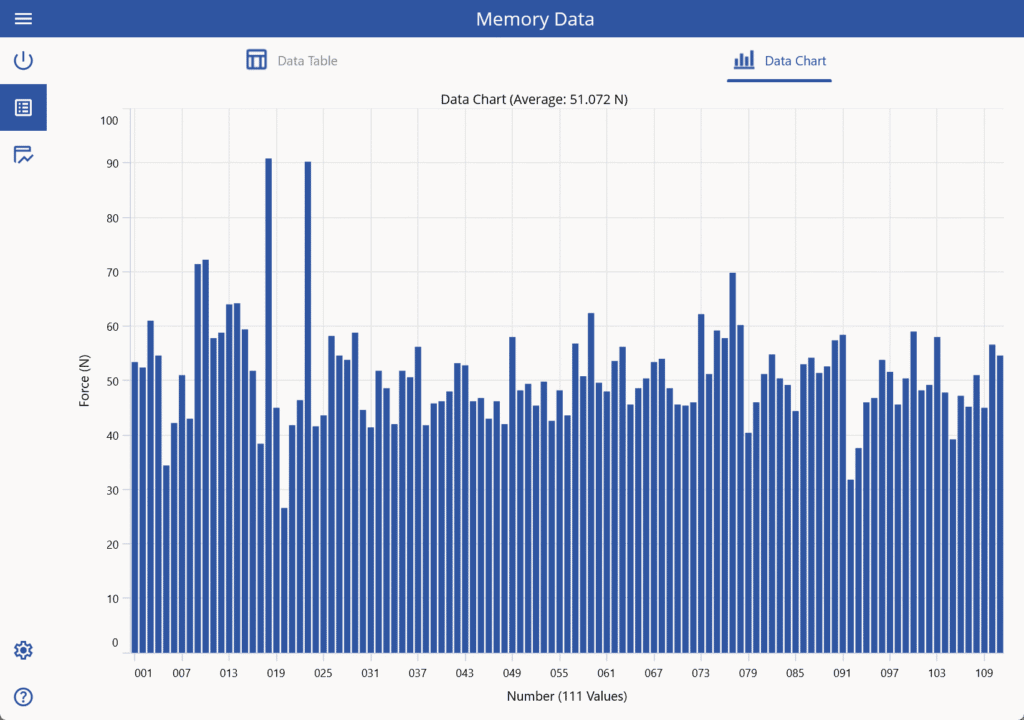
- View data bar chart
- Data statistics overview
- Save the chart PNG to Pictures
Real-time Graphing
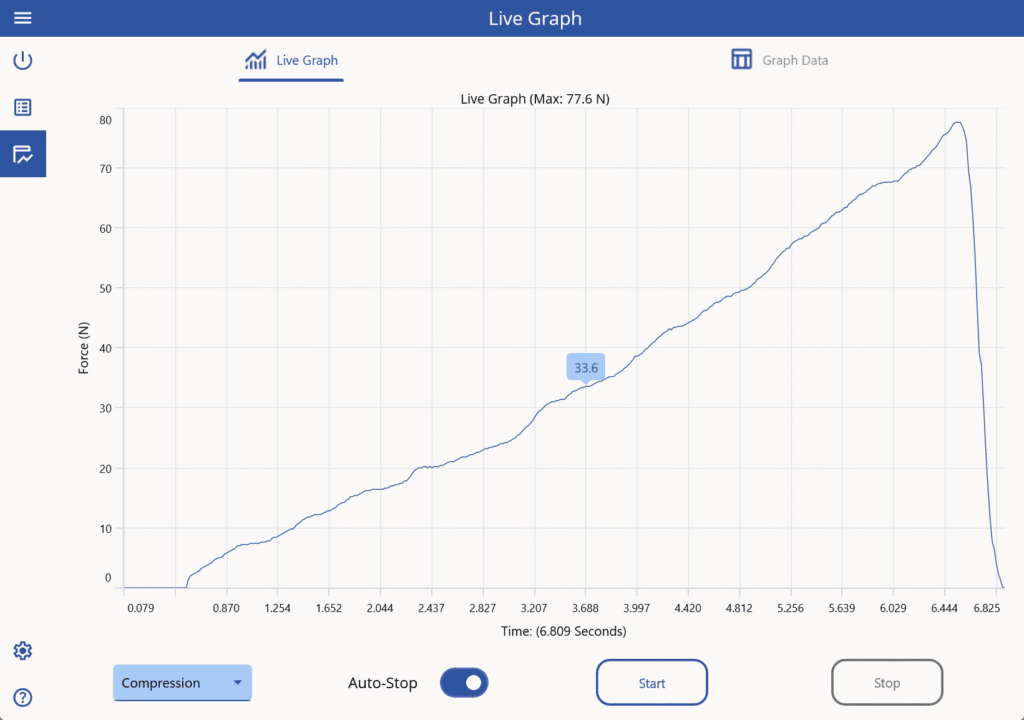
- Real-time graph of test data (force gauges only)
- Over 50 data points per second*
- Auto-stop the test when values drop to zero
*Average between 50 – 60 data points per second
(Actual results may vary depending on device baud rate)
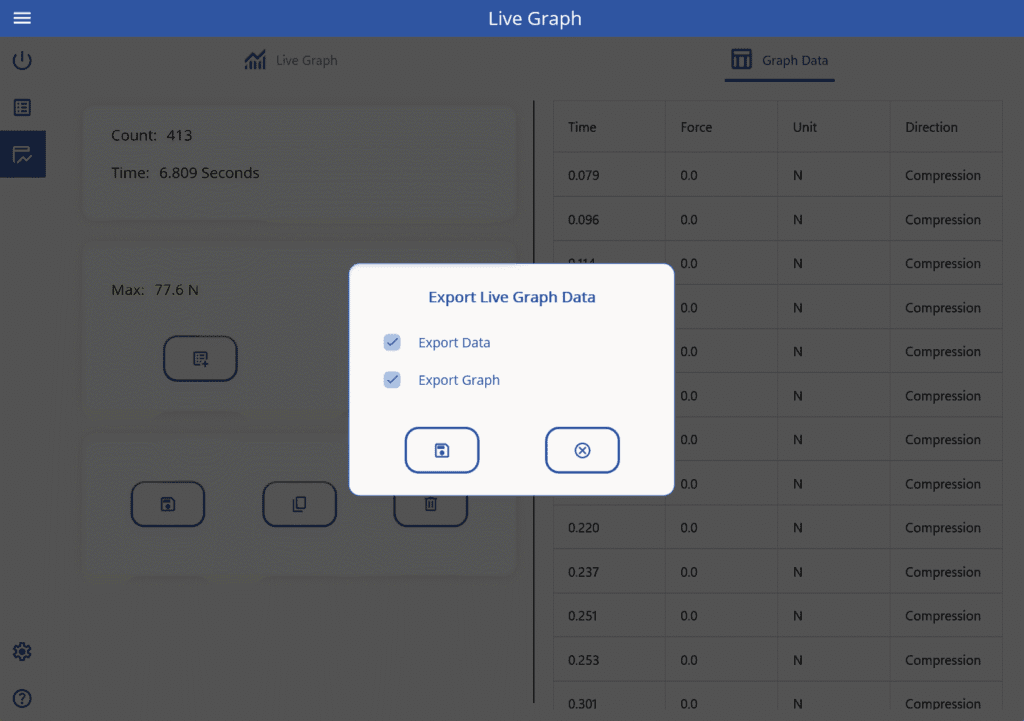
- Add peak value to the memory data table
- Select rows to copy or delete
- Export live test data as CSV or PNG
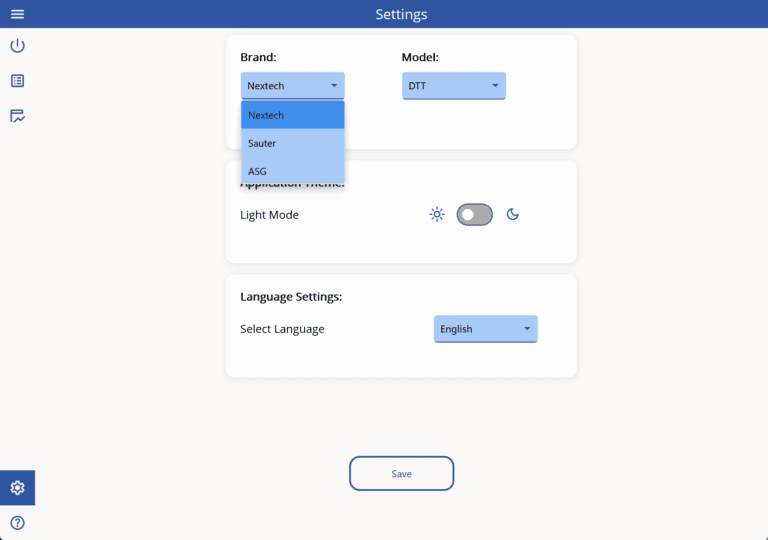
Supports Different Devices
- Works with force gauges and torque testers sold by Nextech, Sauter, and ASG
- Supports light or dark theme
- Available in German, English, Japanese, Spanish, and Thai
NexGraph Python Library
Write scripts in Python to interact with your force gauge using NexGraph’s Python library, ‘nexgraphpy‘. Install it using the ‘pip’ command. Tested with Python versions 3.10 and higher. Read the documentation here: https://python.nexgraphapp.com.